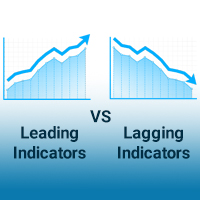
Core Strategy: Leading vs Lagging indicators
Published by Sharekhan Education | December 22, 2022

Behzad Elavia | Sharekhan Education
Core Strategy: Leading vs Lagging indicators
In today’s stock market we have millions of retailers trading and executing the orders. Some trade for investments, some trade for intra-day opportunities. The reason I say, “Retailers” is because there is a general sense of trading practice / style of trading which doesn’t reflect in consistent results. Novices / amateurs / retailers are often influenced with lots of emotions, lack of specialized study, incorrect position sizing etc resulting in frequent loss. In my decade of trading experience, I have seen clients, people, friends, students frequently using lagging indicators as a standalone tool which is an inaccurate study as the only thing active on the charts are the prices itself.
What is the concept of Core Strategy?
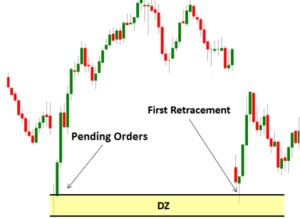
The concept of core strategy revolves around the law of institutional filled orders vs unfilled orders which can be seen directly on the charts. This can only be read by the trained eye as demand & supply results in imbalance activity / big moves on the charts. And for those who cannot identify the institutional buying/selling areas; end up taking wrong decisions as buying at retail (expensive) prices and selling at wholesale (cheap) prices. Thus, this imbalancing activity can only be seen on a price chart with bigger moves and formations, taught by us, in the curriculum.
Leading Indicator
The emotions of greed, fear, panic, euphoria etc can surely be seen on the price charts in form of candlesticks. Hence, price charts contain all the information you need, only if you know what you are looking for. These candlesticks help us read Live/Real-Time situation which in turn helps the trader to identify low risk, high reward, high probability trades. Any other source or information of data that have already taken place could be in terms of data, conventional analysis are defined as lagging indicators.

Lagging Indicator
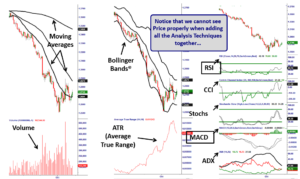
A lagging indicator can be defined as an indication to buy/sell only after a substantial price movement. The retailers in the market use various indicators, namely RSI, Stochastics, Bollinger bands, Moving averages, CCI, Ichimoku, etc. A core strategy student avoids using these indicators as they can clearly see the real demand-supply levels on the chart, as their mind is trained to do so.

Core Strategy with Lagging Indicators
However, there are some indicators which helps us find the true movement of price action when we use volumes and DATR. The reason I say true movement, is because, this remains true over a period of time in turn helping us to gauge the market turning points well in advance.
Volumes can help us identify substantial quantum of data for the area with demand and supply.
DATR help us know the relative price movement on an average a trader would expect to complete an entry / place the stop loss.
Conclusion –
Hence, a student should never rely solely on the standalone indicator. A blend with the concept of filled order is thoroughly accepted. To know more about other such trading strategies attend our Free Power Money Workshop.
By enrolling in this stock market course, you can learn various aspects of trading in Futures and Options Trading.


