Relative Strength Index (RSI)
Published by Sharekhan Education | December 9, 2022

-By Ankit Saxena
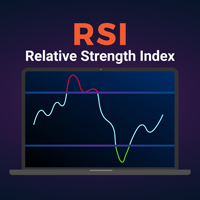
Relative Strength Index or RSI is a leading momentum indicator developed by J Welles Wilder. RSI is a momentum oscillator which measures the rate and pace of price movement of a security over a period of time. It measures the change in price momentum and therefore, helps in identifying a trend reversal. RSI indicator swings between 0 and 100. RSI value above 70 is considered overbought, and below 30 is considered oversold.
The term “Relative strength index” is at times misunderstood by traders, as it does not compare the relative strength of the two securities but rather shows the internal strength of the security itself. RSI appears among the most popular leading indicator as it gives out the strongest trading signals during periods of sideways and non-trending price ranges.
The entire purpose of RSI is to help the trader identify oversold and overbought opportunities in the market. Overbought scenario tells the trader that the stock or market has entered a high positive momentum and it may not sustain for a long period and therefore there might be a correction. Similarly, an oversold scenario tells the trader that the stock or market has entered a high negative momentum and it may not sustain for a long period and therefore there might be possible reversal.
Calculation:
	        100
RSI = 100 - ---------
	     1 + RS

RS = Average Gain/Average Loss
The RSI calculation is fairly simple, just break it down into basic components: RS, Average Gain and Average Loss. The standard period of calculation, which is also called as the “look back period” is 14. The first calculations for average gain and average loss are simple 14-period averages:
-
- Average Gain = Sum of gains over the past 14 periods/14
- Average Loss = Sum of losses over the past 14 periods/14
The second calculation is to calculate the RS and punch the figures in the formula.
Divergence
Divergence signals a strong reversal point, as the directional momentum does not confirm price. A bullish divergence occurs when the underlying security makes a lower low whereas RSI forms a higher low. Here, RSI does not confirm the lower low and thus indicates that price is strengthening and could show a possible reversal. A bearish divergence occurs when the underlying security makes a higher high whereas RSI forms a lower high. Here, RSI does not confirm the new high and thus indicates that price is weakening and could show a possible reversal.
For a better understanding of the Relative Strength Index and other trading concepts visit us on Sharekhaneducation. Or attend our Free Power Money Workshop.
By Enrolling in this stock market course, you can learn various aspects of Futures and Options Trading.


