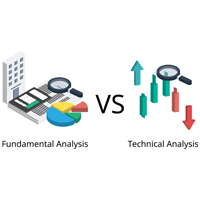

Technical analysis and fundamental analysis are the two main approaches used by investors to evaluate stocks. Both methods have pros and cons, but combining them offers a more comprehensive view of a stock.
Technical analysis is a step-by-step process of evaluating securities by analysing the price action generated by the market activity of buyers and sellers. Technical analysts believe that the market discounts everything and that they can use the historical performance of a stock to predict its future performance. They use charts and technical indicators to identify patterns and trends that can indicate buy and sell opportunities. Some of the popular technical indicators include moving averages, the relative strength index (RSI), and Bollinger Bands. Technical analysts also use candlestick patterns and chart patterns to identify potential buying and selling opportunities.
Fundamental analysis, on the other hand, is a method of evaluating a stock by analysing its financial and economic fundamentals, such as its earnings, revenue, and assets. Its aim is to determine the intrinsic value of a stock and compare it to its current market price. Fundamental analysts believe that they can determine a stock’s true value by analyzing its financial statements and management team. They also consider macroeconomic factors such as interest rates, inflation, and GDP growth.
Technical analysis can identify short-term trends, benefiting day traders and short-term investors. It aids in recognizing overbought and oversold conditions, guiding stock buying or selling decisions. Investors can also use technical analysis in conjunction with other forms of analysis, such as fundamental analysis, to confirm trades.
Fundamental analysis, on the other hand, provides a more complete understanding of a stock’s true value and long-term potential. It can assess a company’s financial health and growth potential. A company with strong fundamentals, such as a low debt-to-equity ratio, a high return on equity, and consistent earnings growth, is considered more likely to provide strong returns in the long run.
However, it’s worth mentioning that both methods have their own limitations as well. Technical analysis does not take into account the underlying financial and economic fundamentals of a stock, which can be important for long-term investors. Additionally, technical indicators are based on past market data, and there is no guarantee that past performance will be repeated in the future.
Fundamental analysis also has its own limitations. It does not take into account market sentiment and short-term trends, which can be important for short-term traders. It might not reflect the impact of events like mergers on a stock’s short-term price.
Many investors use a a combination of technical and fundamental analysis to make investment decisions. For example, an investor might use technical analysis to identify a stock that is trending upward and then use fundamental analysis to determine if the stock is undervalued or overvalued. Furthermore, a combination of both methods can help investors make a well-informed decision.
In conclusion, technical and fundamental analysis are two different methods of evaluating stocks. While both have their own advantages and disadvantages, using a combination of both methods can provide a more complete understanding of a stock and help investors make better investment decisions.
It’s worth mentioning that using images or a visual representation of the data can make the analysis clearer and easier to comprehend. For example, a stock chart with technical indicators over-layed can provide a clear picture of the stock’s historical performance and how it might perform in the future. Similarly, using visuals such as a candlestick chart, bar chart, or Renko chart.
For a better understanding of technical and fundamental analysis visit us on: Sharekhan Education website. Go through our extensive courses and pick out the one that best caters to your needs!
By enrolling in this stock market course, you can learn about the various aspects of Futures and Options Trading.